District Information
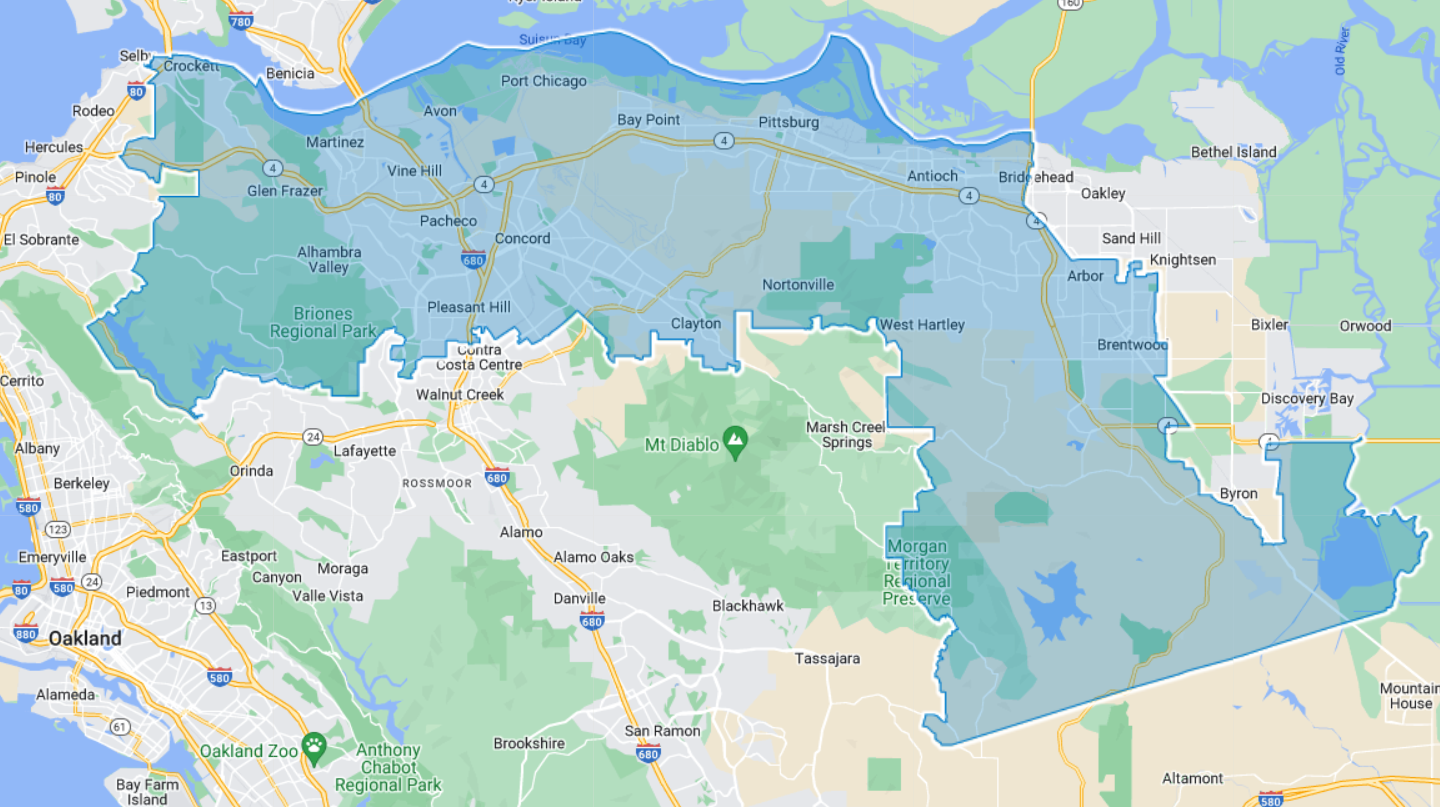
DISTRICT AD15
2020 Census Population (adj Elec. §21003)
| Name | Count | Percent |
|---|
| Total Population (POP) | 512,289 | 100.00% |
|---|
| POP Hispanic or Latino | 163,715 | 31.96% |
|---|
| POP Not Hispanic or Latino (NH) | 348,574 | 68.04% |
|---|
| POP NH Population of one race | 318,899 | 62.25% |
|---|
| POP NH White alone | 189,720 | 37.03% |
|---|
| POP NH Black or African American alone | 50,108 | 9.78% |
|---|
| POP NH Asian alone | 70,582 | 13.78% |
|---|
| POP NH American Indian and Alaska Native alone | 1,447 | 0.28% |
|---|
| POP NH Native Hawaiian and Other Pacific Islander alone | 3,627 | 0.71% |
|---|
| POP NH Some Other Race alone | 3,415 | 0.67% |
|---|
| POP NH Population of two or more races | 29,675 | 5.79% |
|---|
2020 Census Housing Occupancy Status
| Name | Count | Percent |
|---|
| Total Housing Units | 180,056 | 100.00% |
|---|
| Occupied | 174,203 | 96.75% |
|---|
| Vacant | 5,853 | 3.25% |
|---|
2020 Census Group Quarters Population (adj Elec. §21003)
| Name | Count | Percent |
|---|
| Total Group Quarters Population: | 4,374 | 100.00% |
|---|
| Institutionalized population: | 2,216 | 50.66% |
|---|
| Correctional facilities for adults | 574 | 13.12% |
|---|
| Juvenile facilities | 88 | 2.01% |
|---|
| Nursing facilities/Skilled-nursing facilities | 1,538 | 35.16% |
|---|
| Other institutional facilities | 16 | 0.37% |
|---|
| Noninstitutionalized population: | 2,158 | 49.34% |
|---|
| College/University student housing | 0 | 0.00% |
|---|
| Military quarters | 0 | 0.00% |
|---|
| Other noninstitutional facilities | 2,158 | 49.34% |
|---|
Counties In District
| Name | Count | Percent |
|---|
| Contra Costa | 512,286 | 43.86% |
|---|
Places In District
| Name | Count | Percent |
|---|
| CONTRA COSTA: Alhambra Valley(U) | 807 | 100.00% |
|---|
| CONTRA COSTA: Antioch(C) | 115,581 | 100.00% |
|---|
| CONTRA COSTA: Bay Point(U) | 23,971 | 100.00% |
|---|
| CONTRA COSTA: Brentwood(C) | 64,381 | 100.00% |
|---|
| CONTRA COSTA: Clayton(C) | 11,085 | 100.00% |
|---|
| CONTRA COSTA: Clyde(U) | 729 | 100.00% |
|---|
| CONTRA COSTA: Concord(C) | 125,615 | 100.00% |
|---|
| CONTRA COSTA: Crockett(U) | 3,251 | 100.00% |
|---|
| CONTRA COSTA: Martinez(C) | 37,349 | 100.00% |
|---|
| CONTRA COSTA: Mountain View(U) | 2,636 | 100.00% |
|---|
| CONTRA COSTA: Pacheco(U) | 4,190 | 100.00% |
|---|
| CONTRA COSTA: Pittsburg(C) | 76,654 | 100.00% |
|---|
| CONTRA COSTA: Pleasant Hill(C) | 34,650 | 100.00% |
|---|
| CONTRA COSTA: Port Costa(U) | 190 | 100.00% |
|---|
| CONTRA COSTA: Reliez Valley(U) | 3,354 | 100.00% |
|---|
| CONTRA COSTA: Vine Hill(U) | 4,329 | 100.00% |
|---|
| CONTRA COSTA: Walnut Creek(C) | 351 | 0.50% |
|---|
| CONTRA COSTA: Remainder of Contra Costa(R) | 3,163 | 30.01% |
|---|
